

Optimizing the generation and analysis of academic reports
Timeline
May to October 2024
Company
Creator4All and FATEC Presidente Prudente
My role
Product Designer
Chanel
Web Application – Reporting Module
Project context
This project was developed as a final capstone project for the Systems Analysis and Development degree program, through an educational partnership between FATEC Presidente Prudente and the company Multimídia Educacional.
Creator4All is a Learning Management System (LMS) by Multimídia Educacional that allows educators to create and share instructional materials with students. It also enables the generation of reports to measure results and make data-driven decisions.
Defined objectives
Analyze and compare Creator4All’s positioning within the current LMS landscape
Understanding Market Perspectives
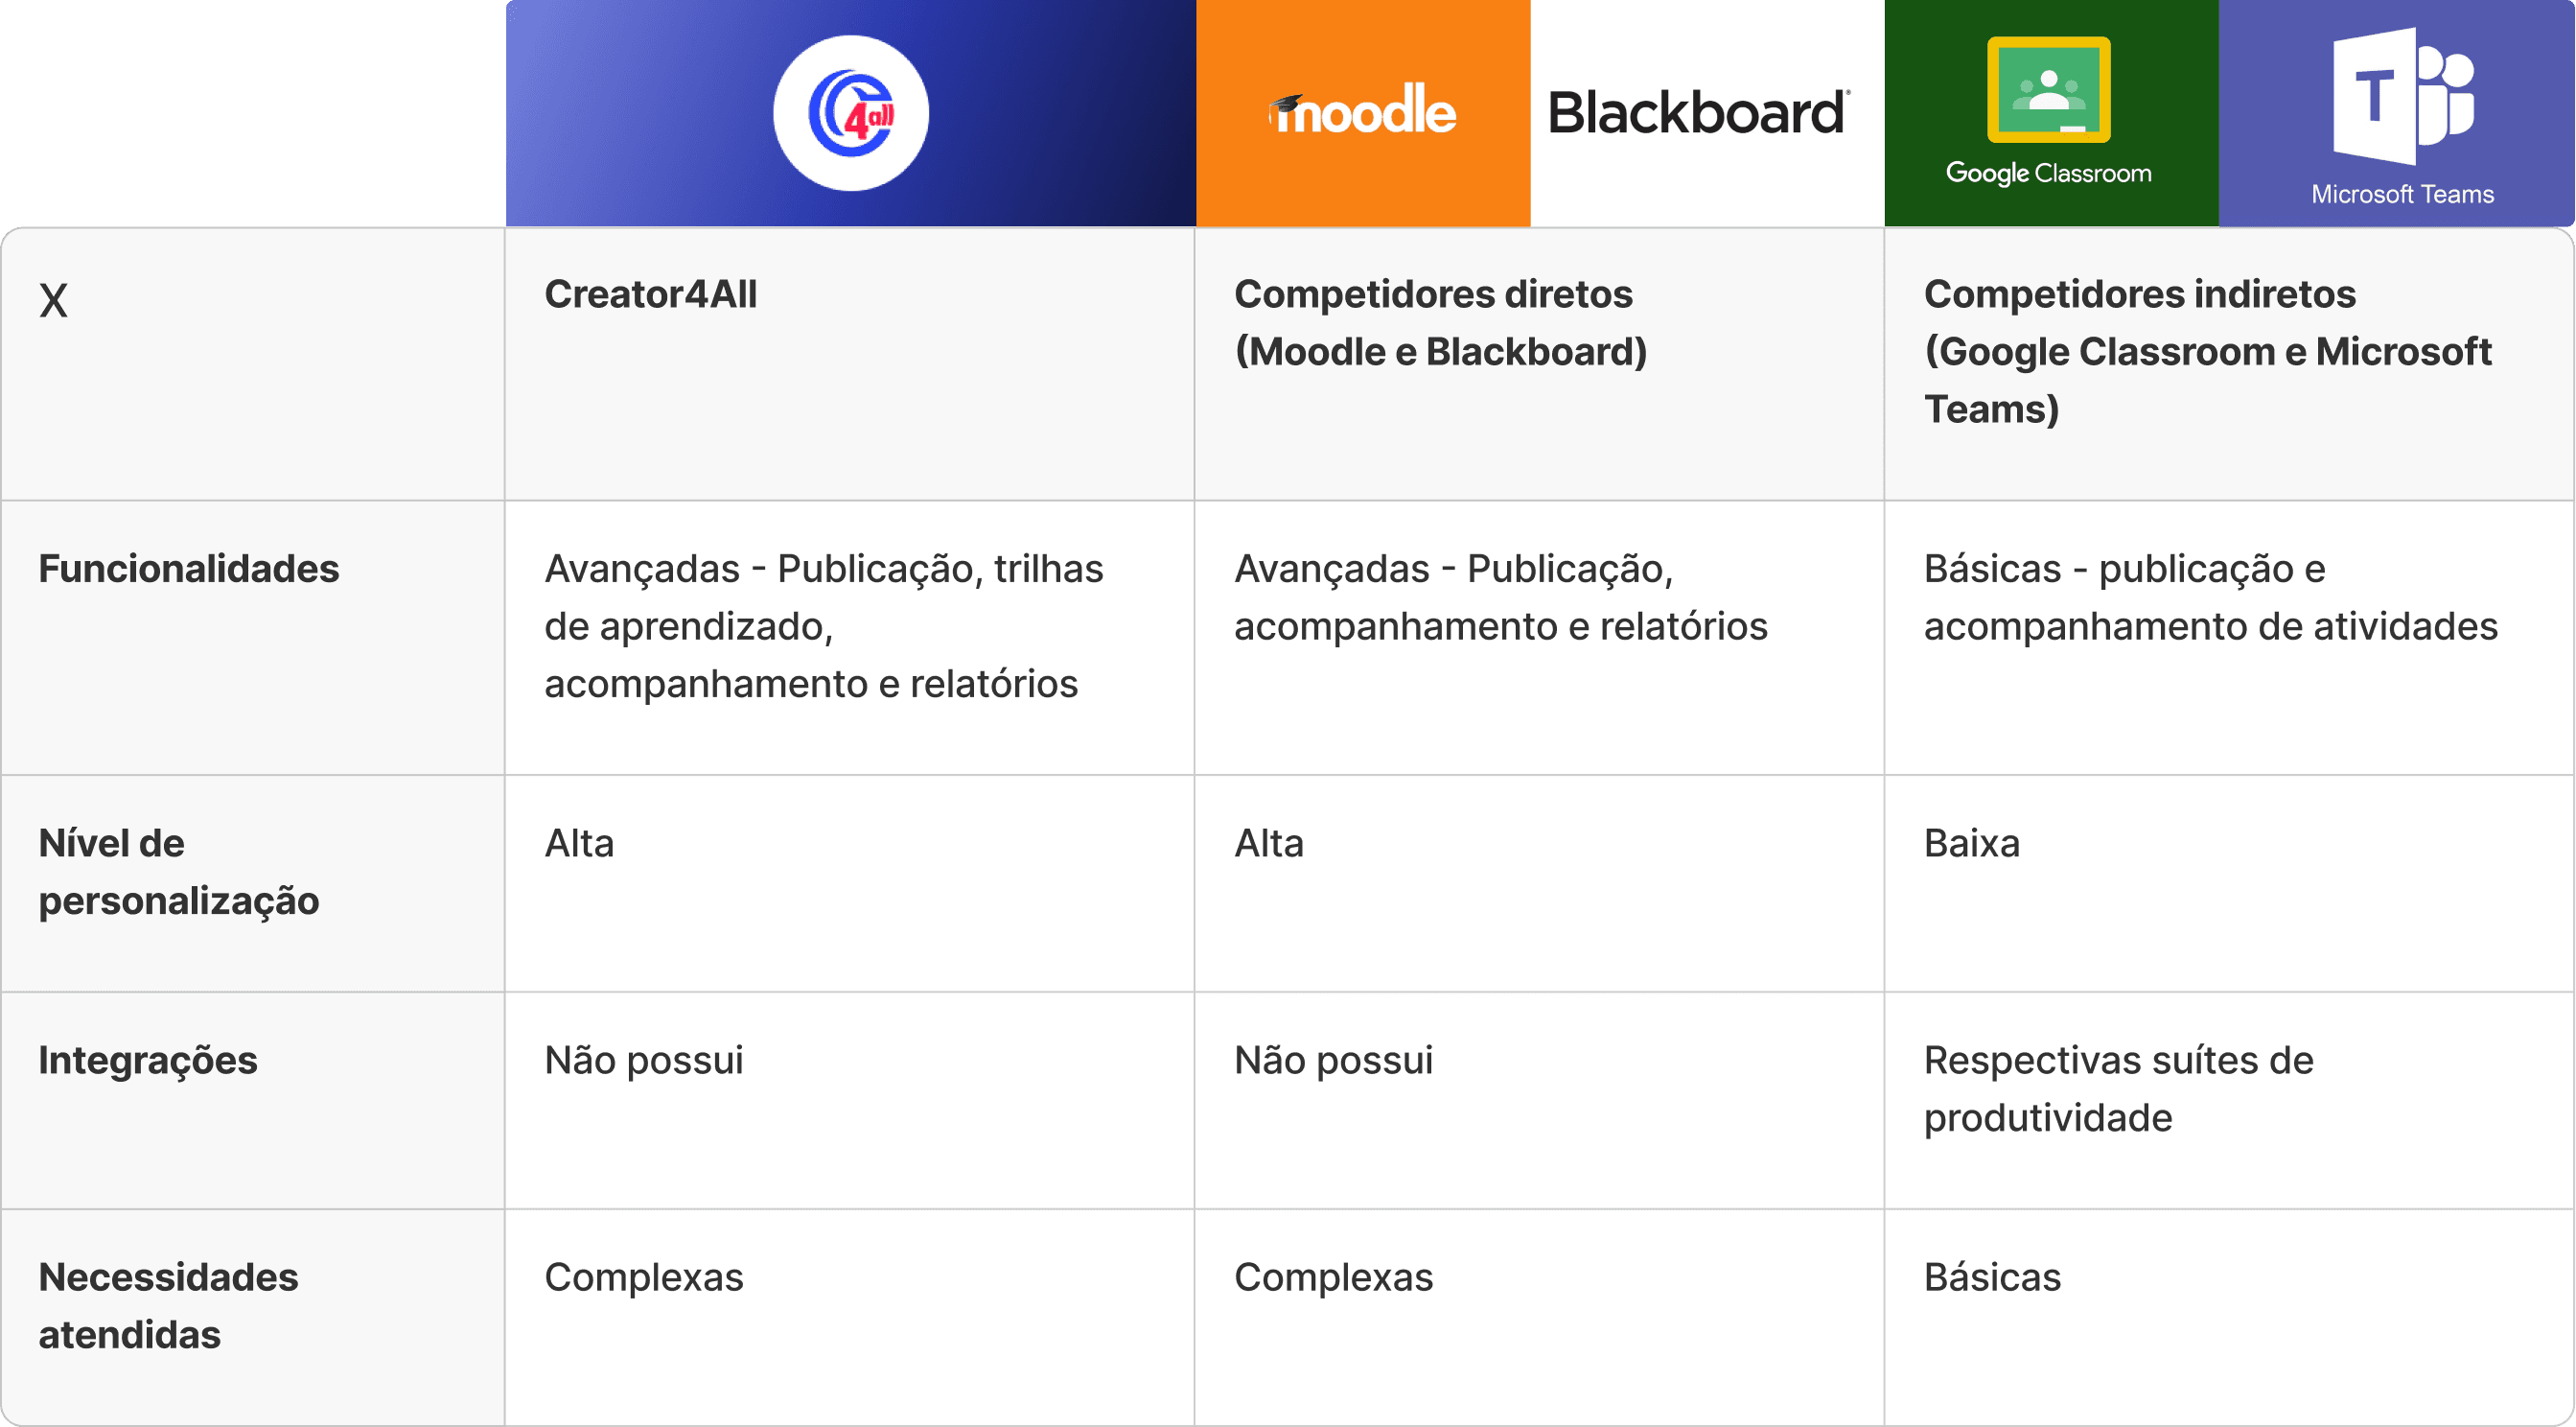
I began by researching and identifying direct and indirect competitors. Afterward, I analyzed everything from their market positioning to their reporting features. You can view a summary of the analysis below:
What do users have to say?
Users find the filters complex and overloaded with options; the platform displays excessive information that users do not necessarily need.
Users are not notified about system updates, leaving them unaware of changes to the platform.
The majority of users did not demonstrate a clear understanding of the available reporting options.
Pedagogical coordinators have to take screenshots of reports to document results.
Approximately 48% of the teachers surveyed stated they were unfamiliar with the system documentation.
Understanding the user profile
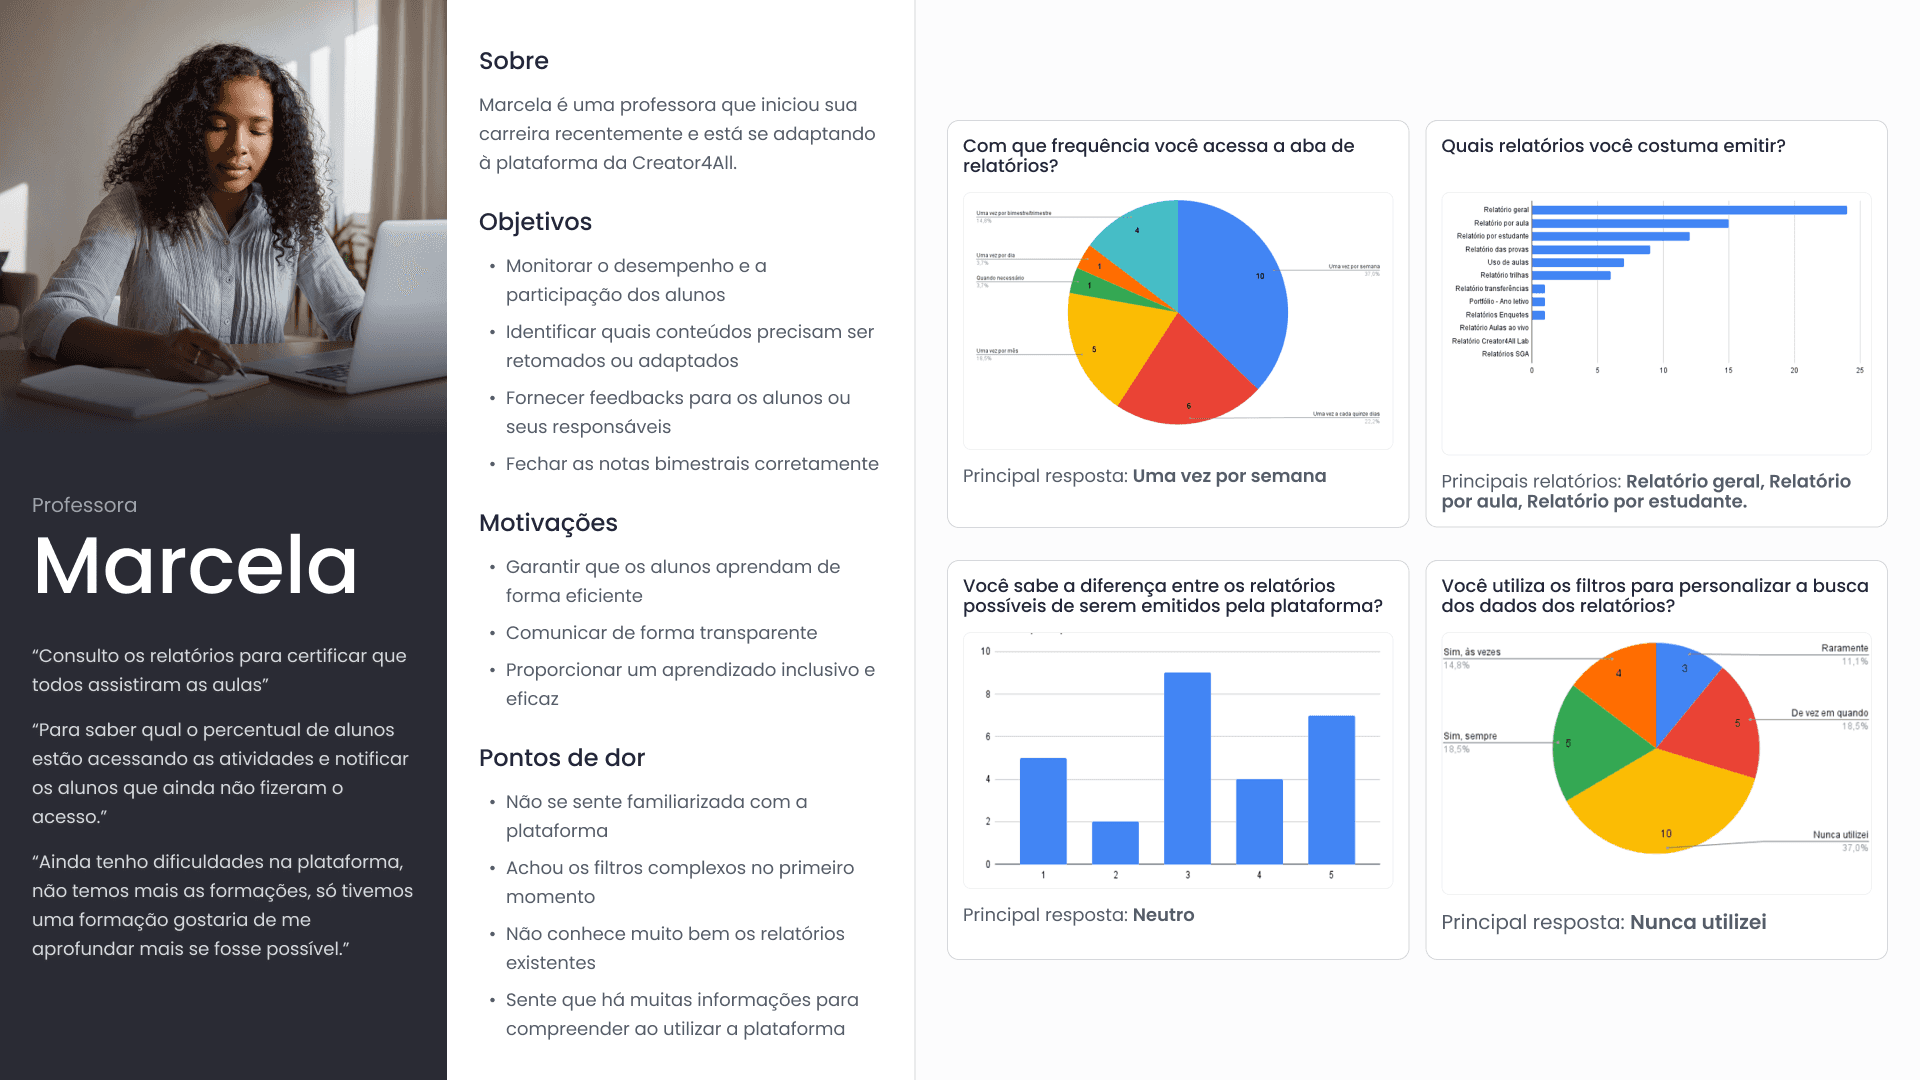
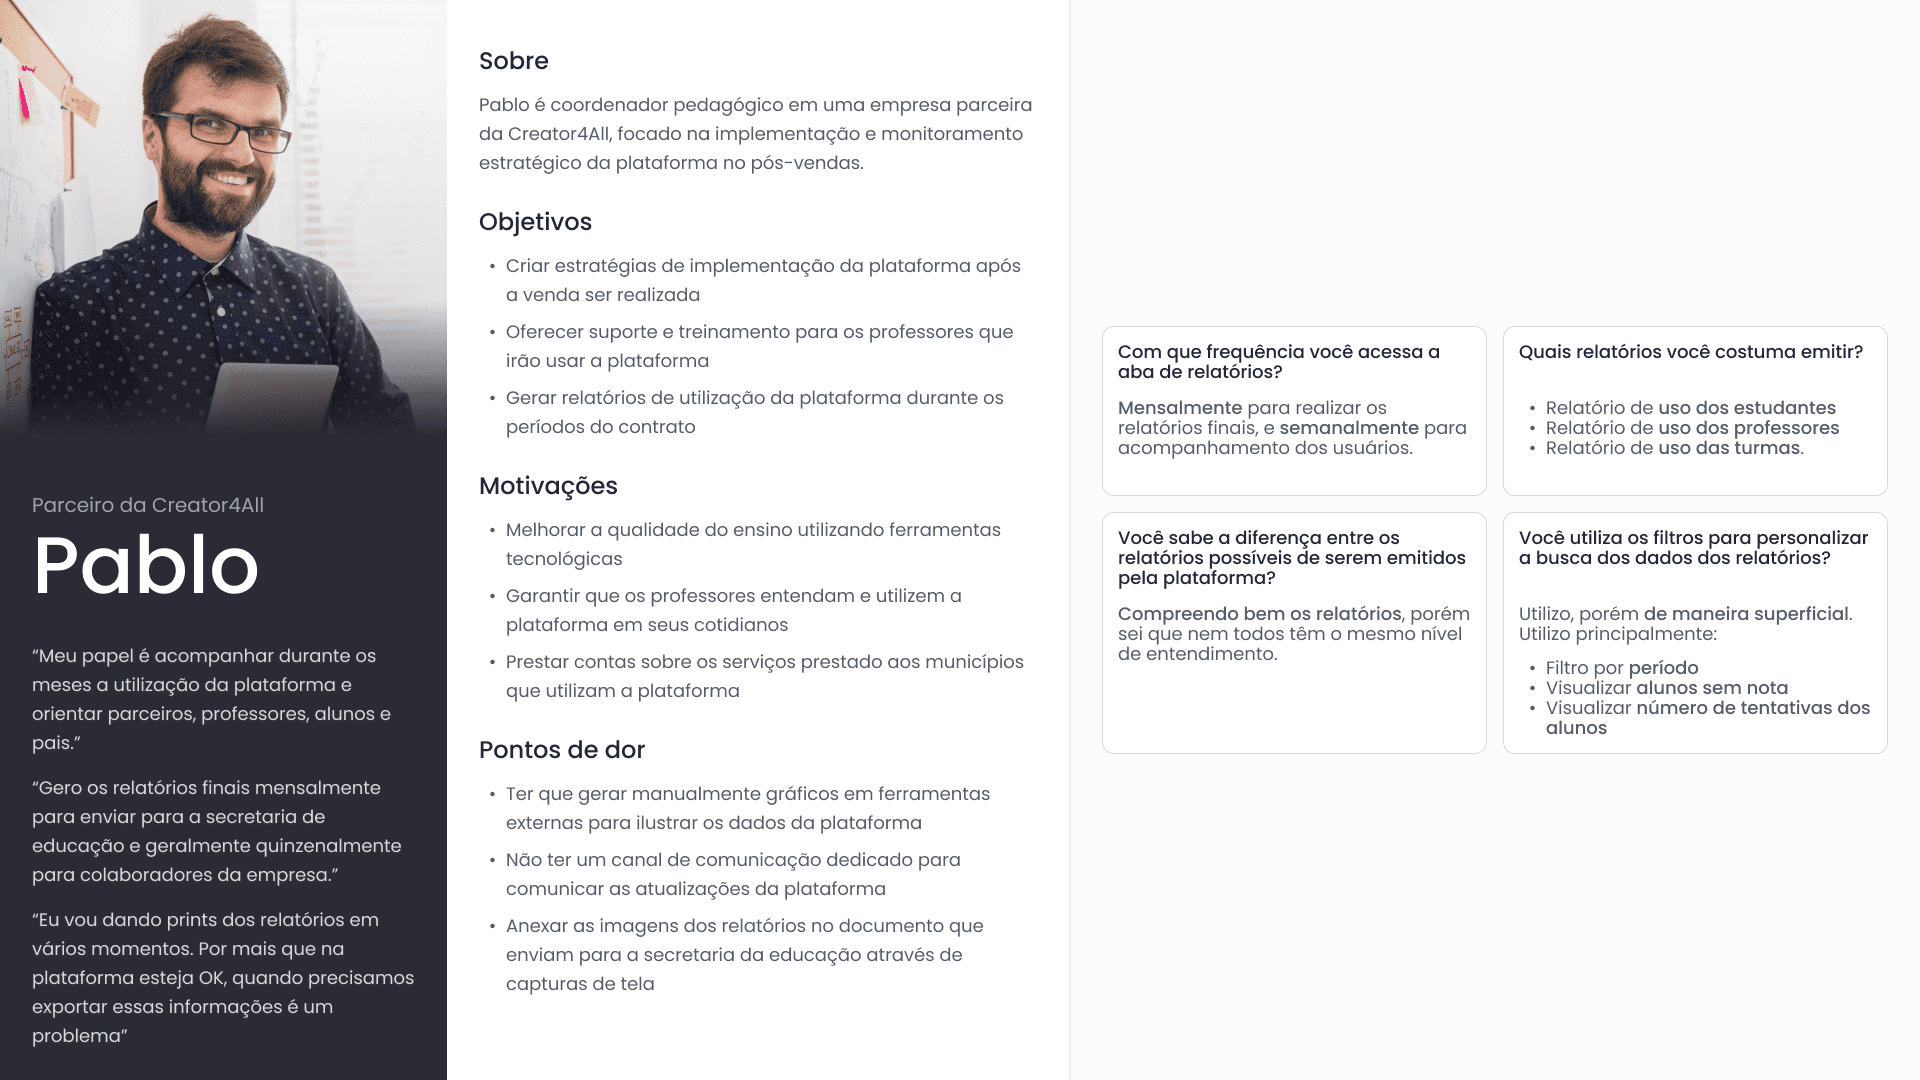
I created two personas to synthesize the results obtained from the research.
Prioritizing necessary efforts
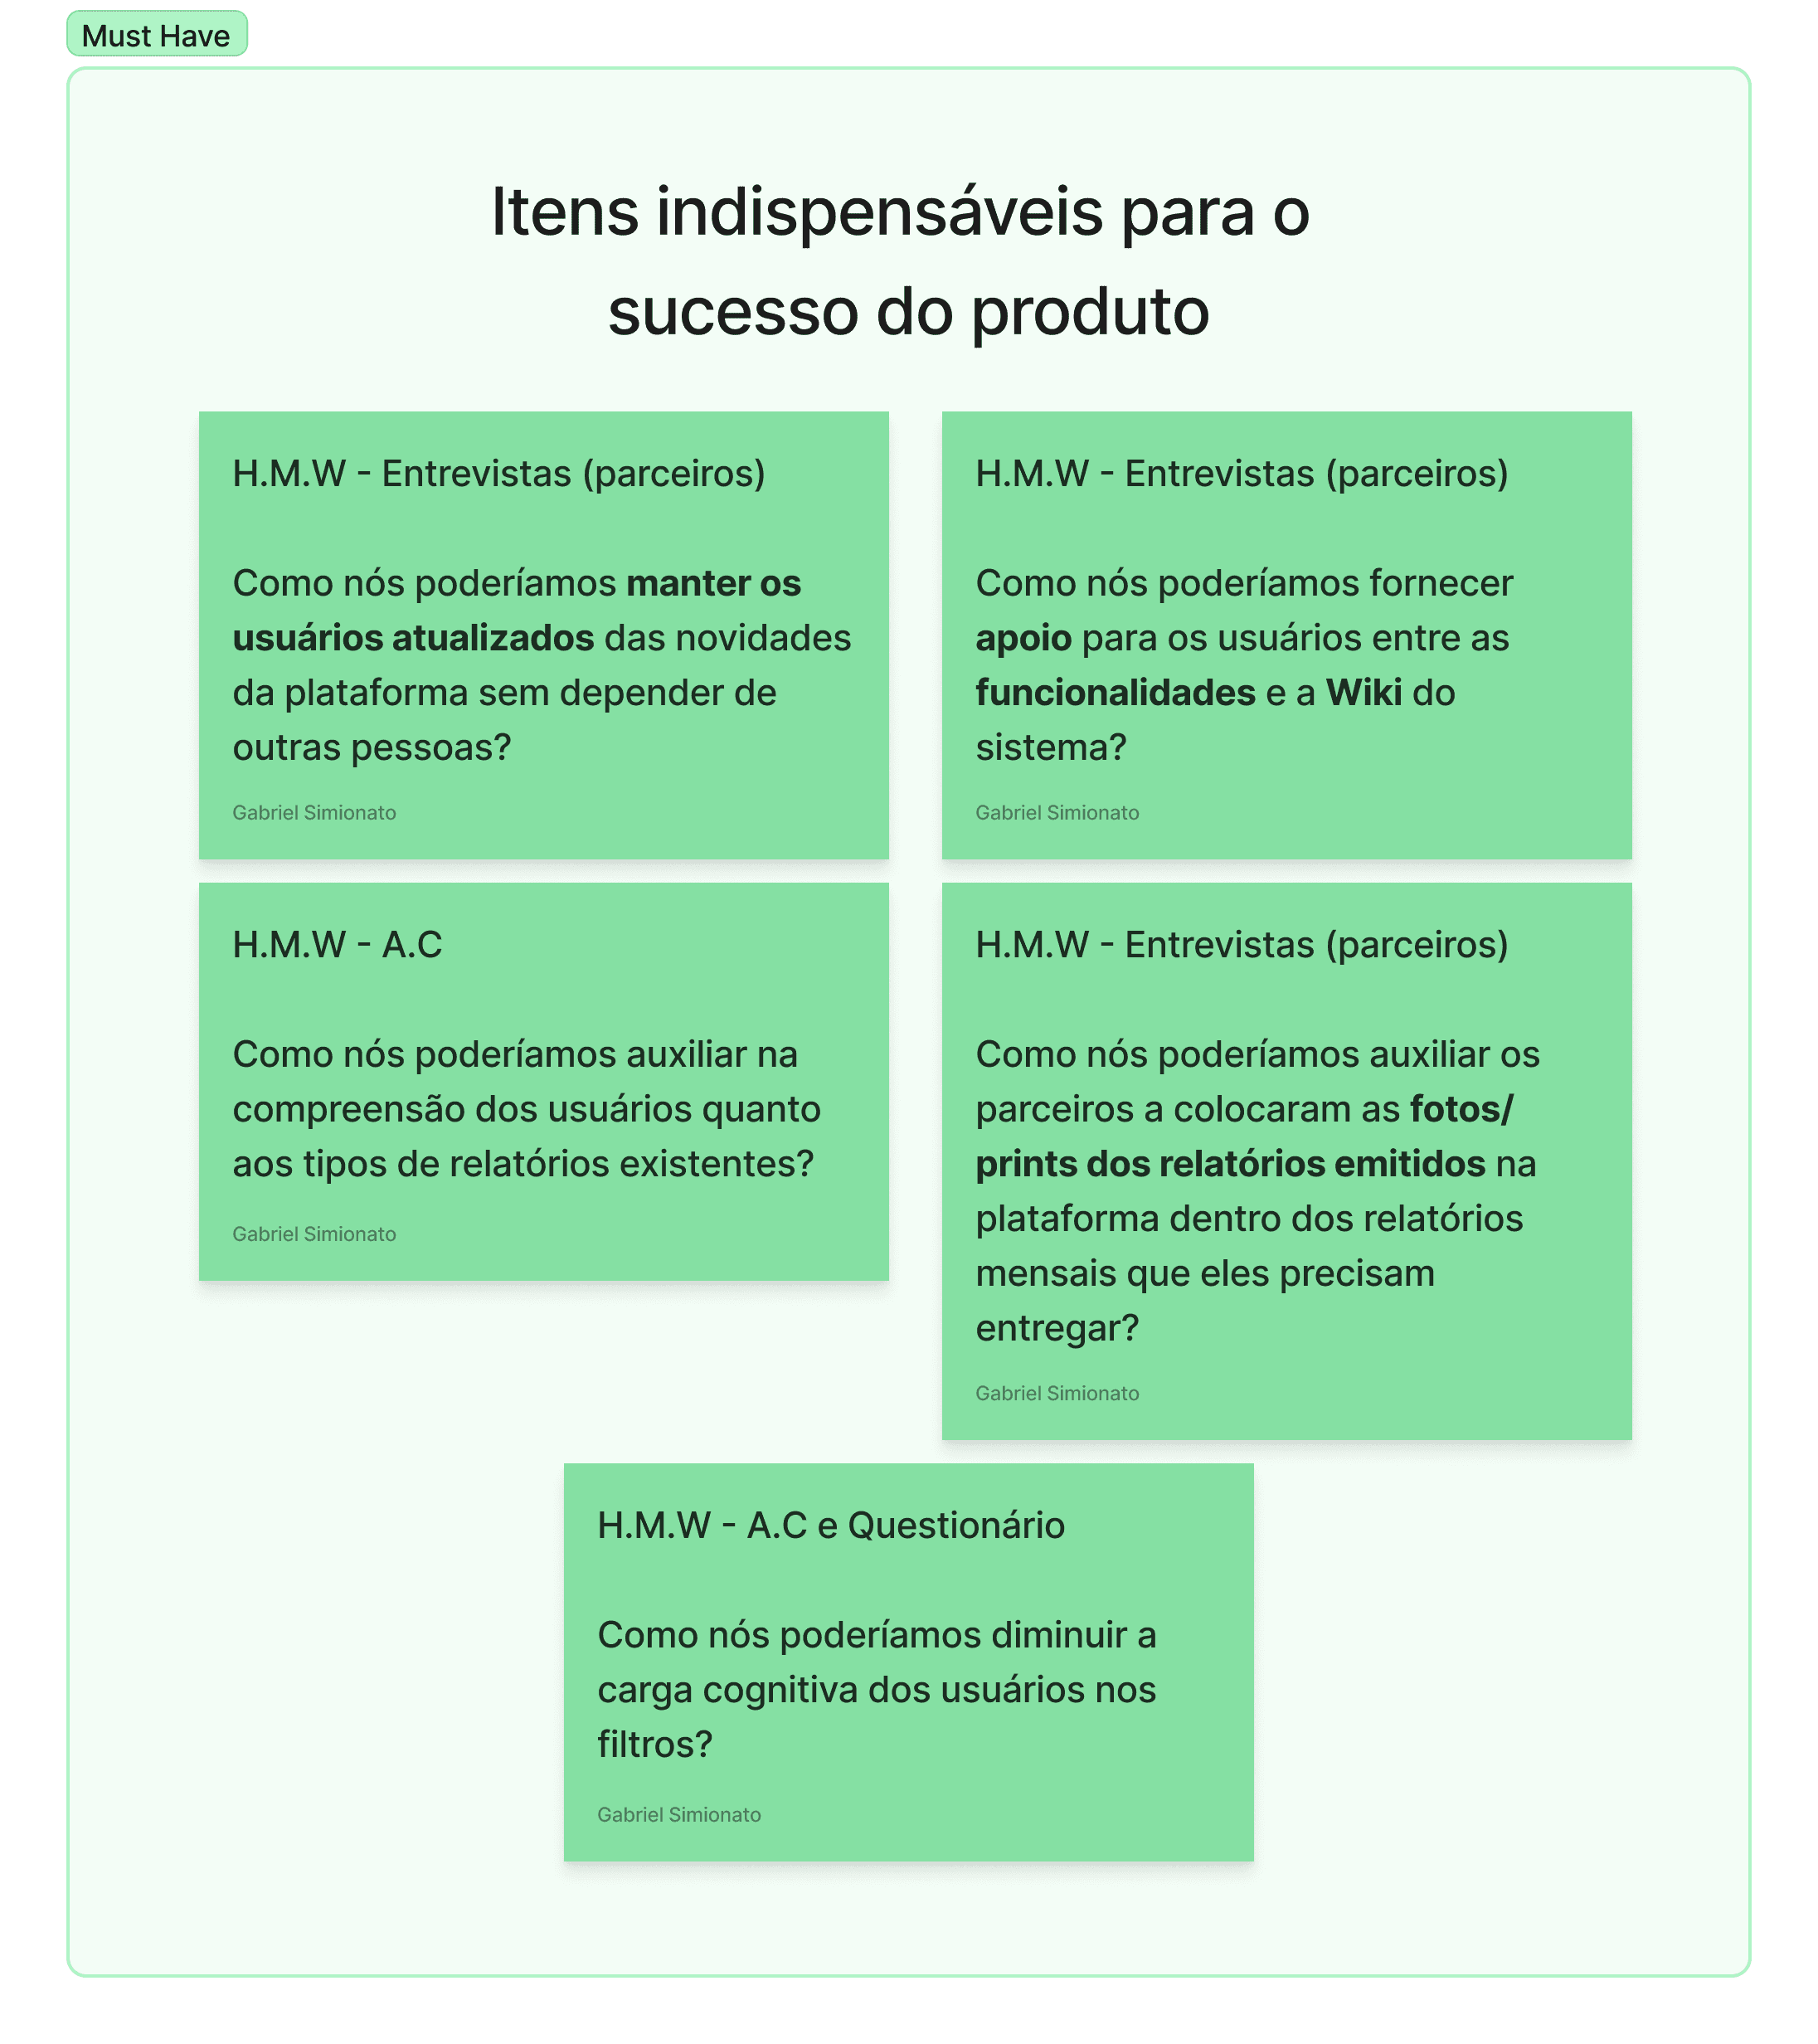
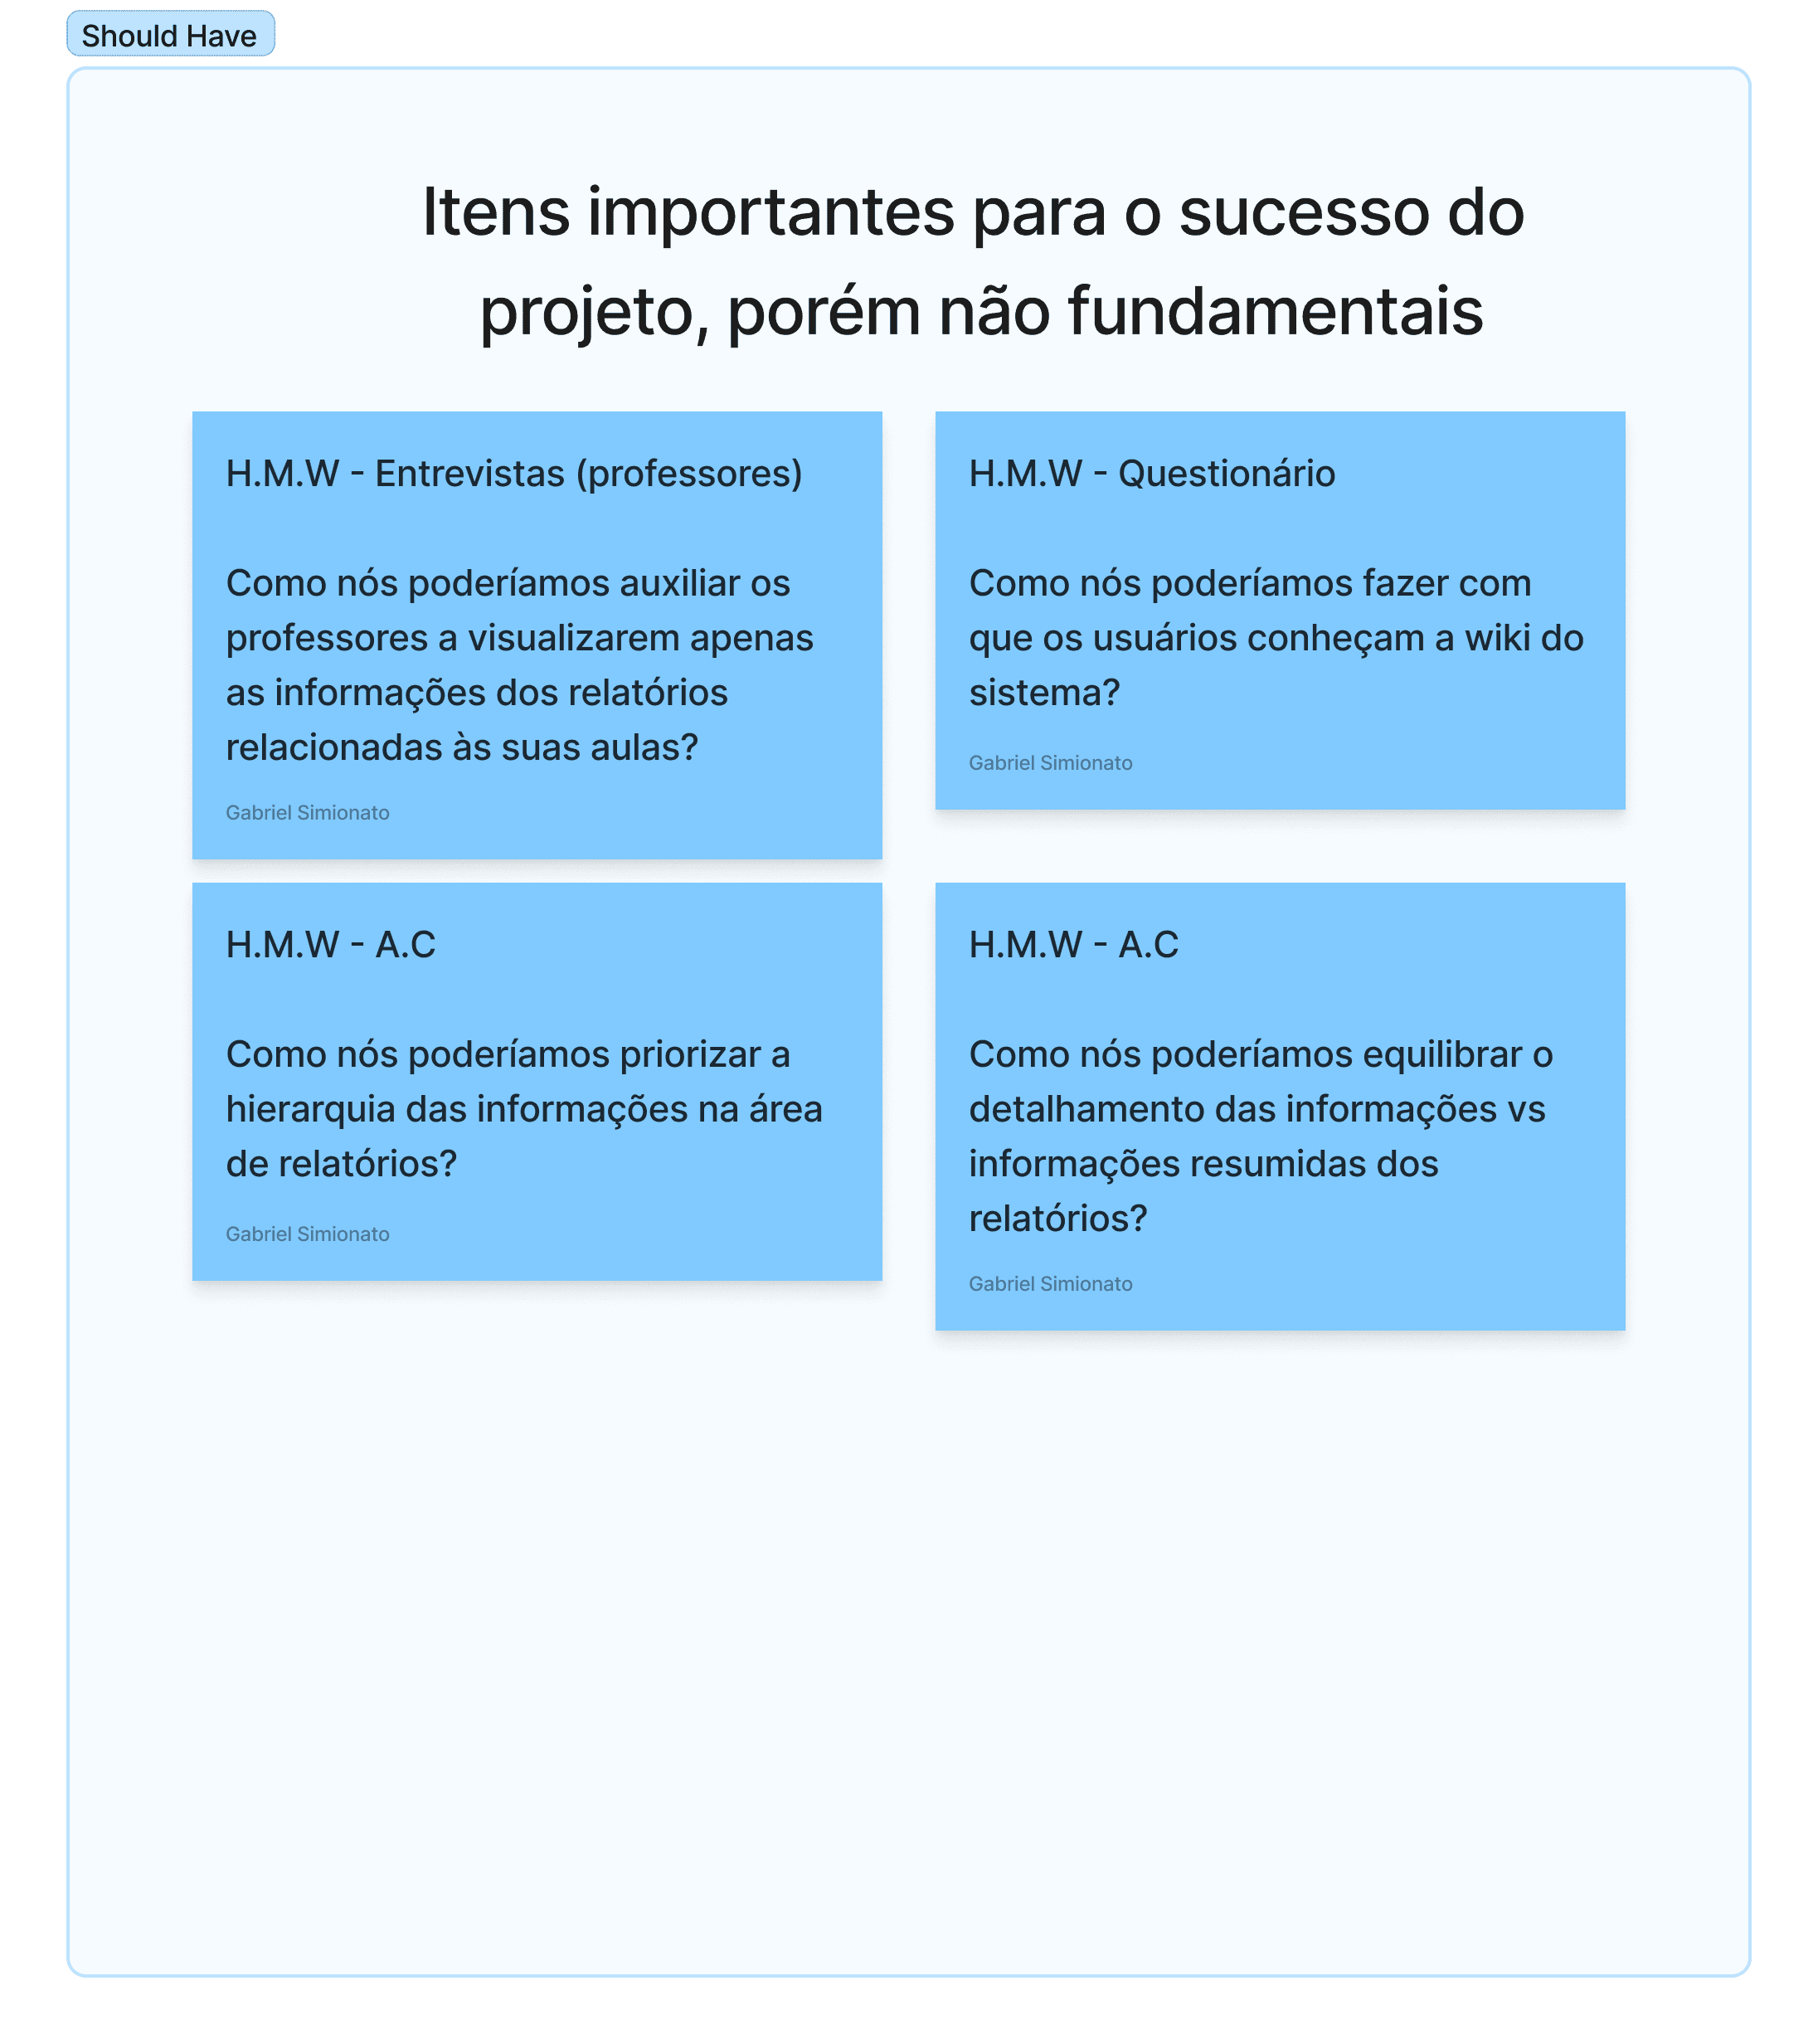
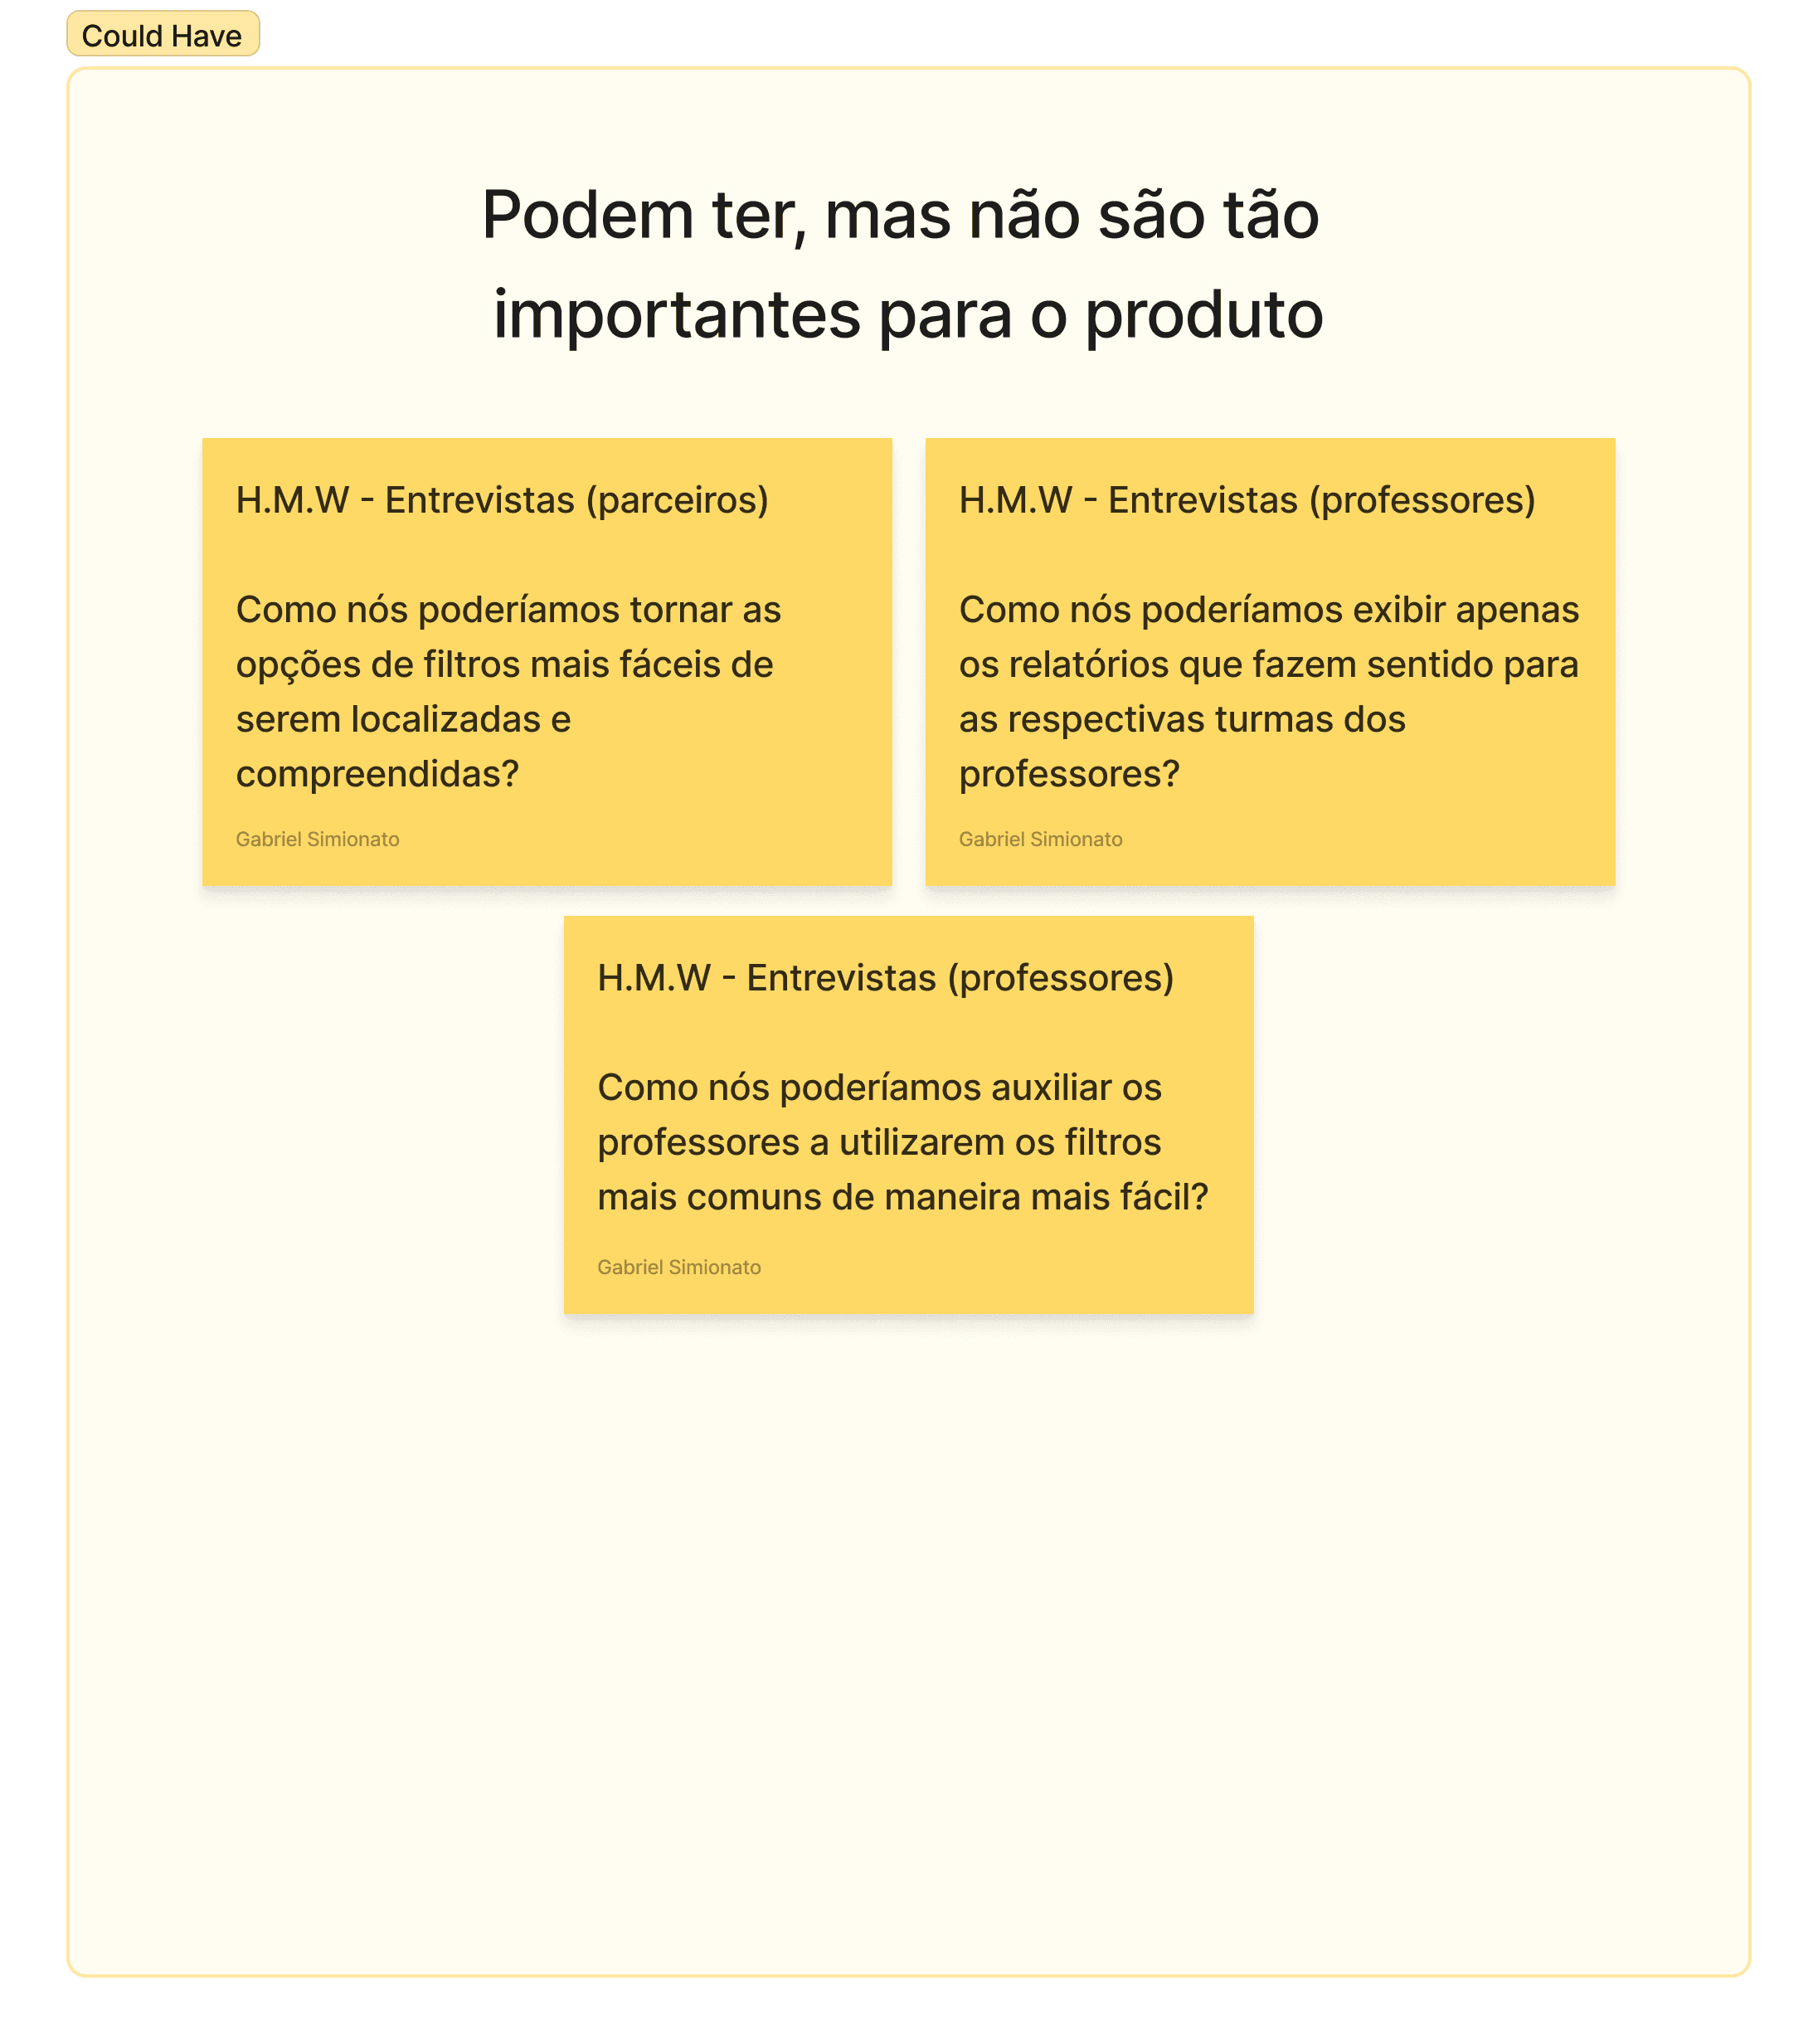
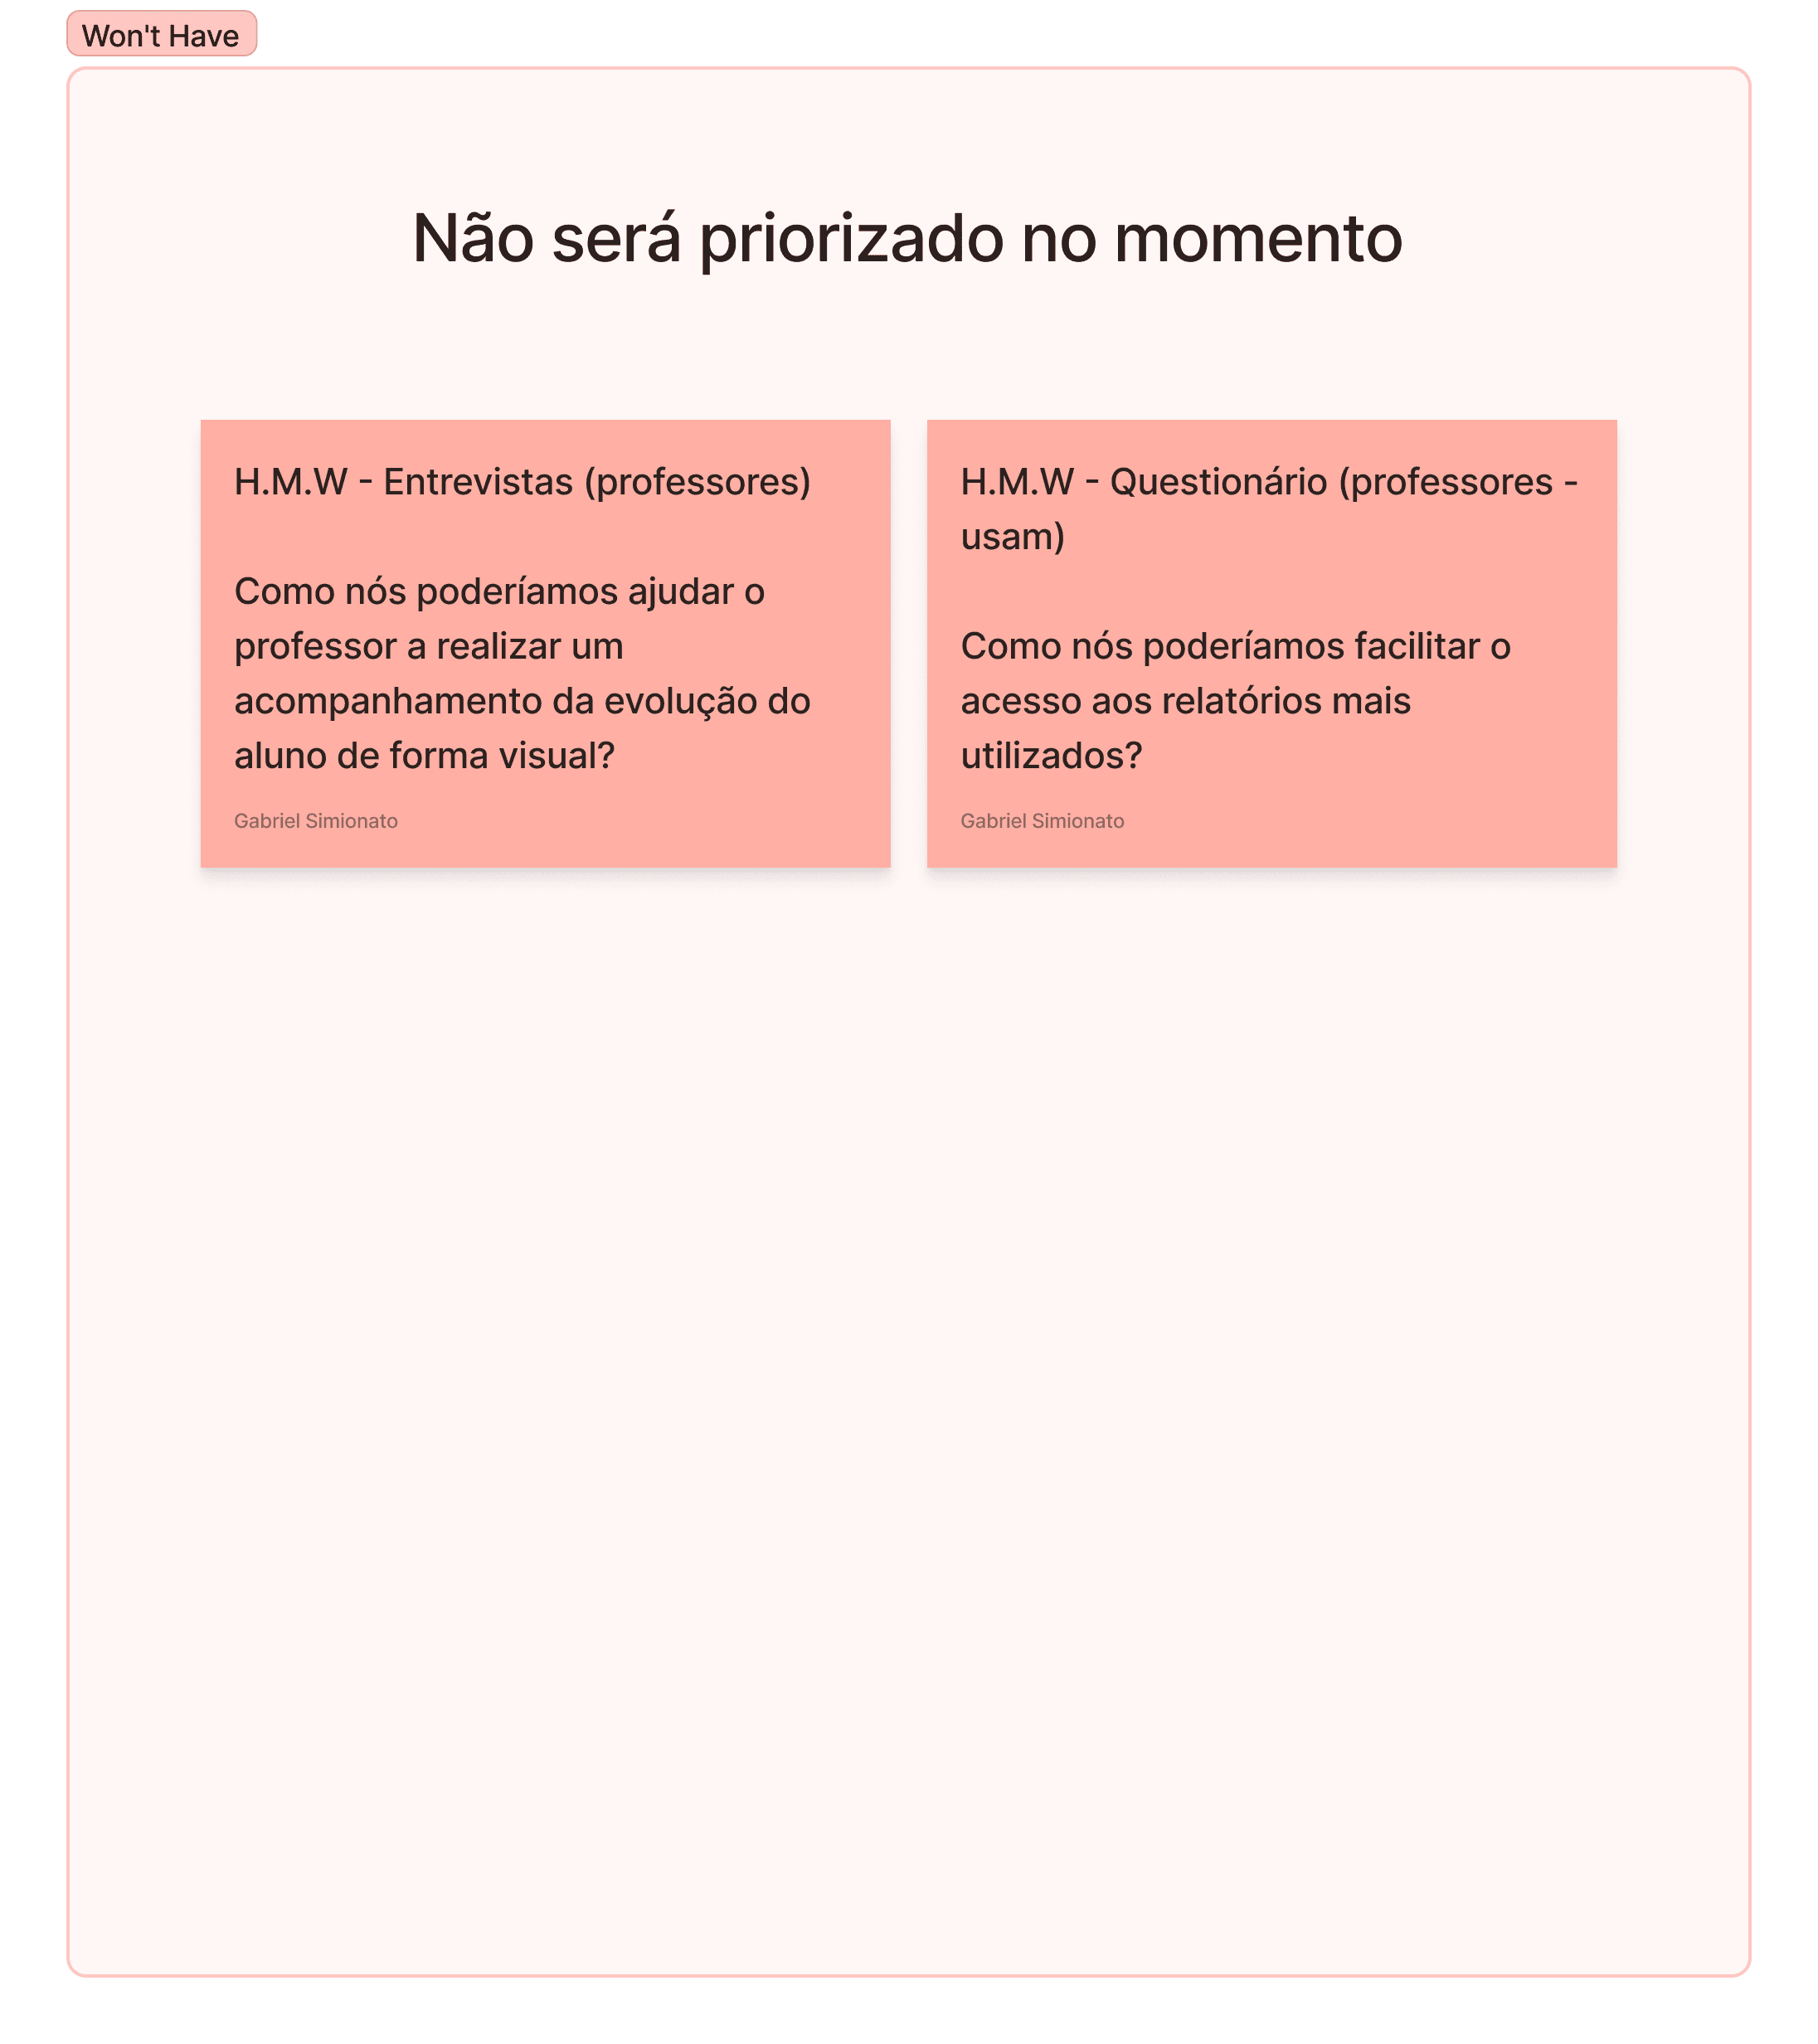
The identified problems were transformed into questions using the "How Might We" technique. Subsequently, I conducted a two-stage prioritization process using an effort-vs.-impact matrix followed by the MoSCoW method.
Exploring potential solutions with low-fidelity sketches
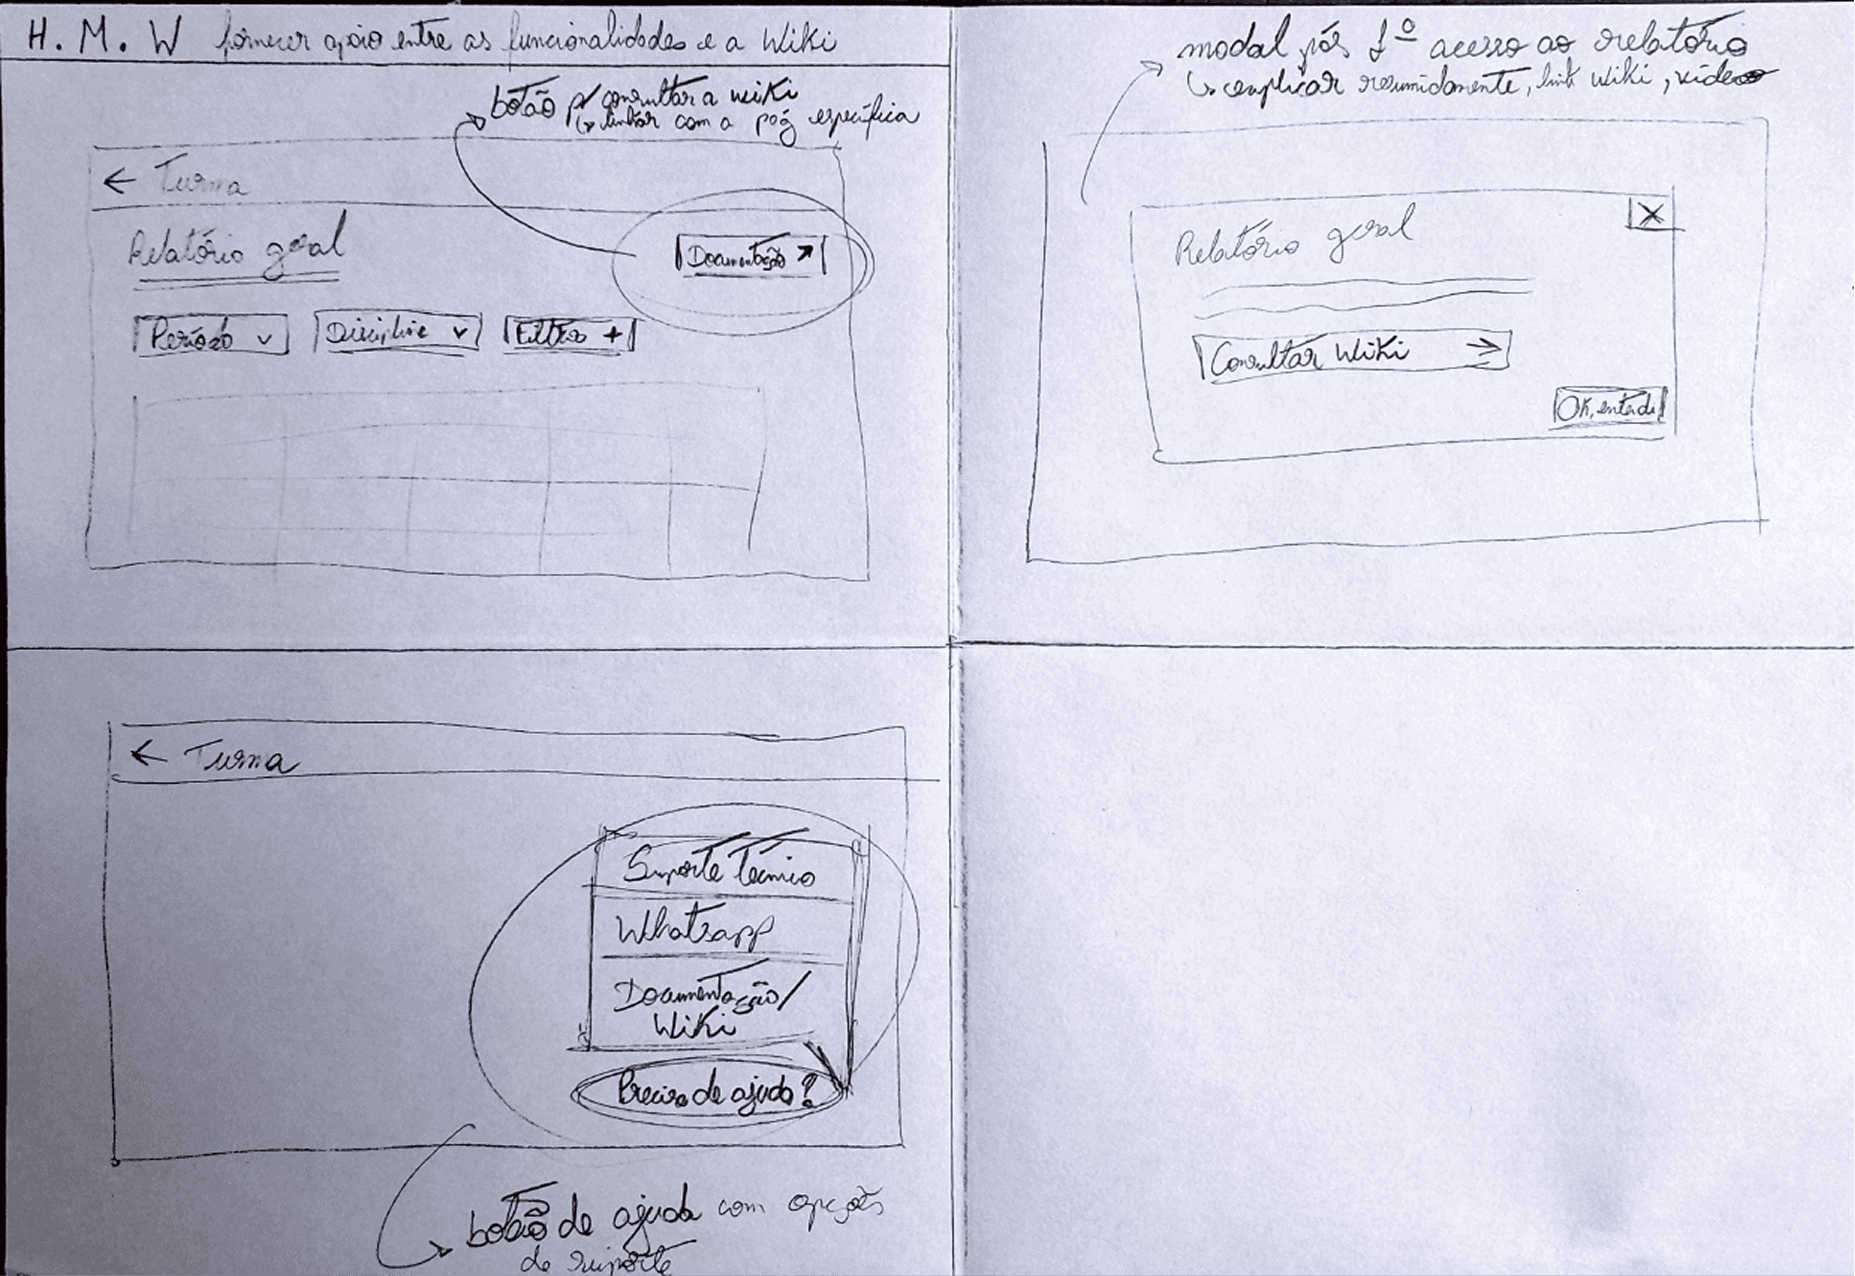
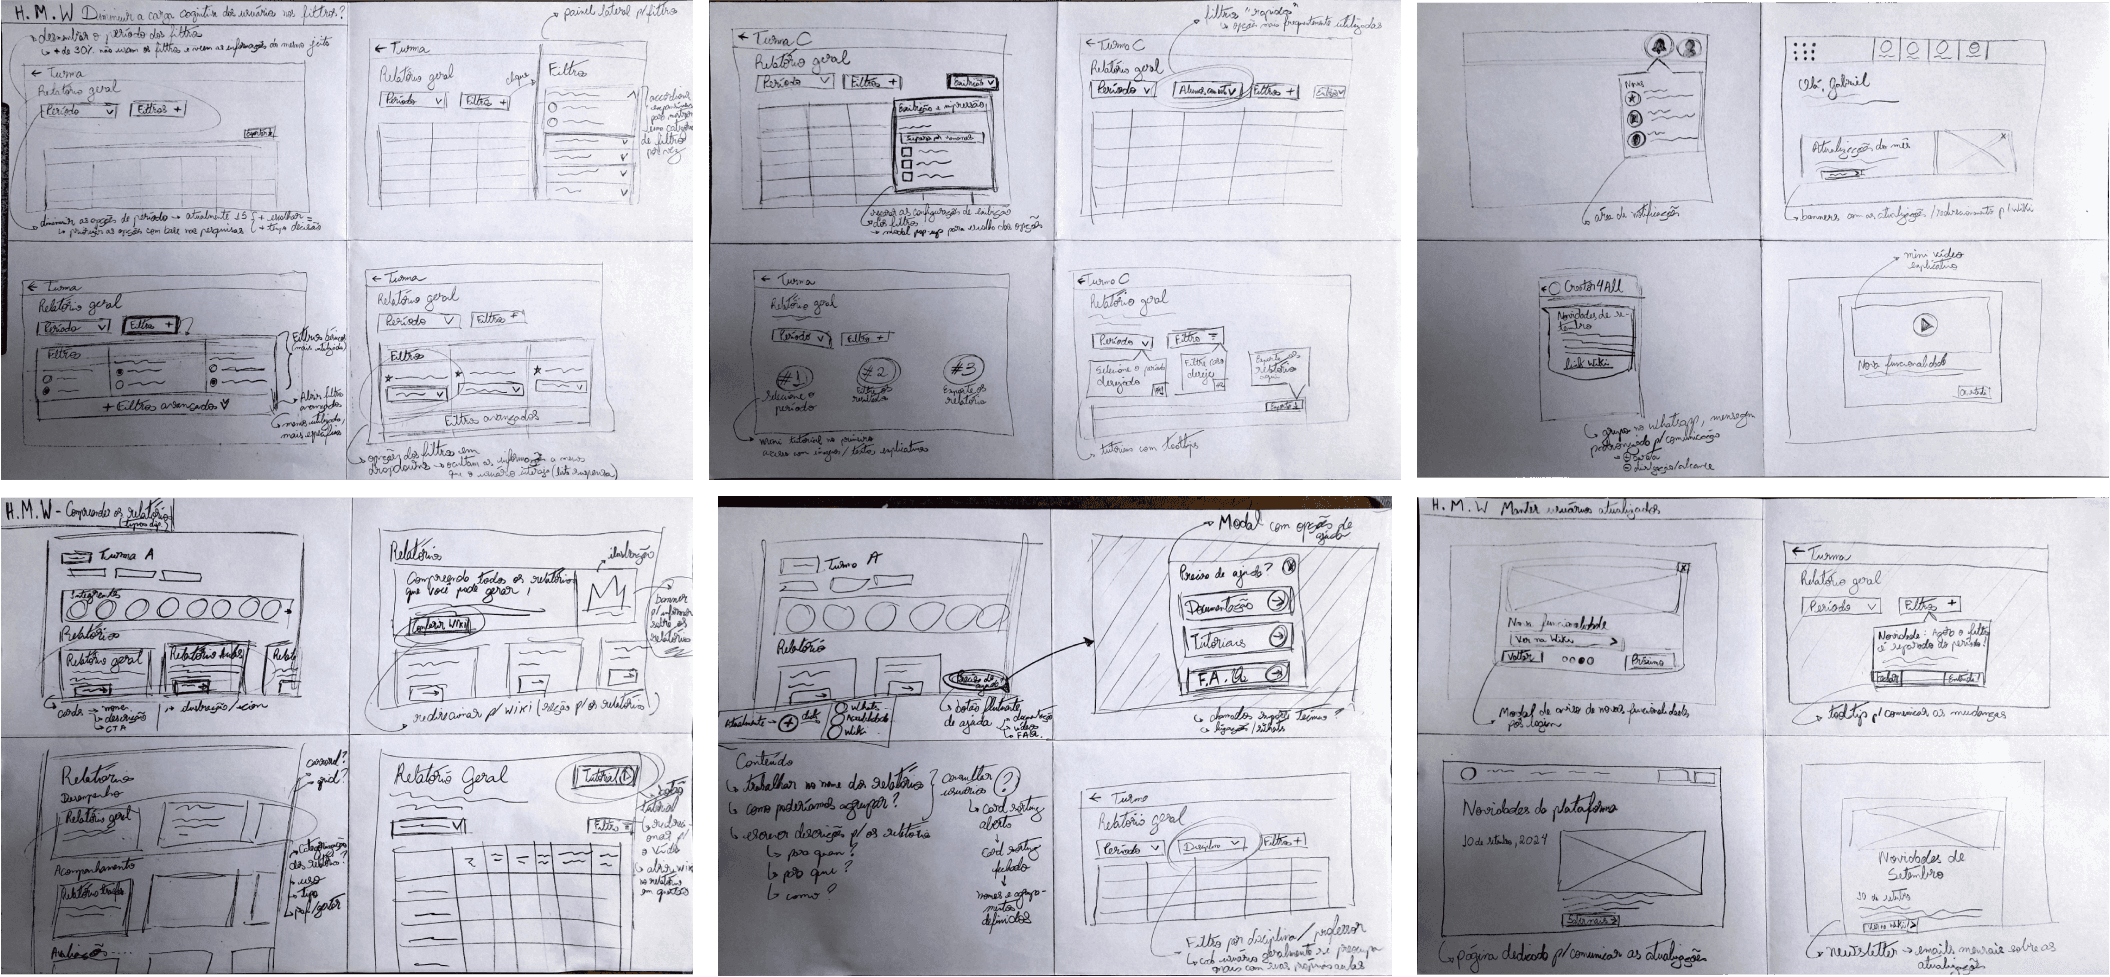
Starting with good old pen and paper, I created low-fidelity wireframes to explore possibilities.


The proposed solutions
Keeping users informed about platform updates
Notifying users about updates can boost perceived value by providing context and helping them familiarize themselves with the platform.
Aiding the understanding and categorization of existing reports
Categorizing reports into tabs, accompanied by clear descriptions, can help users better understand available options and support scalability should new options be added.
Reducing the cognitive load associated with filters
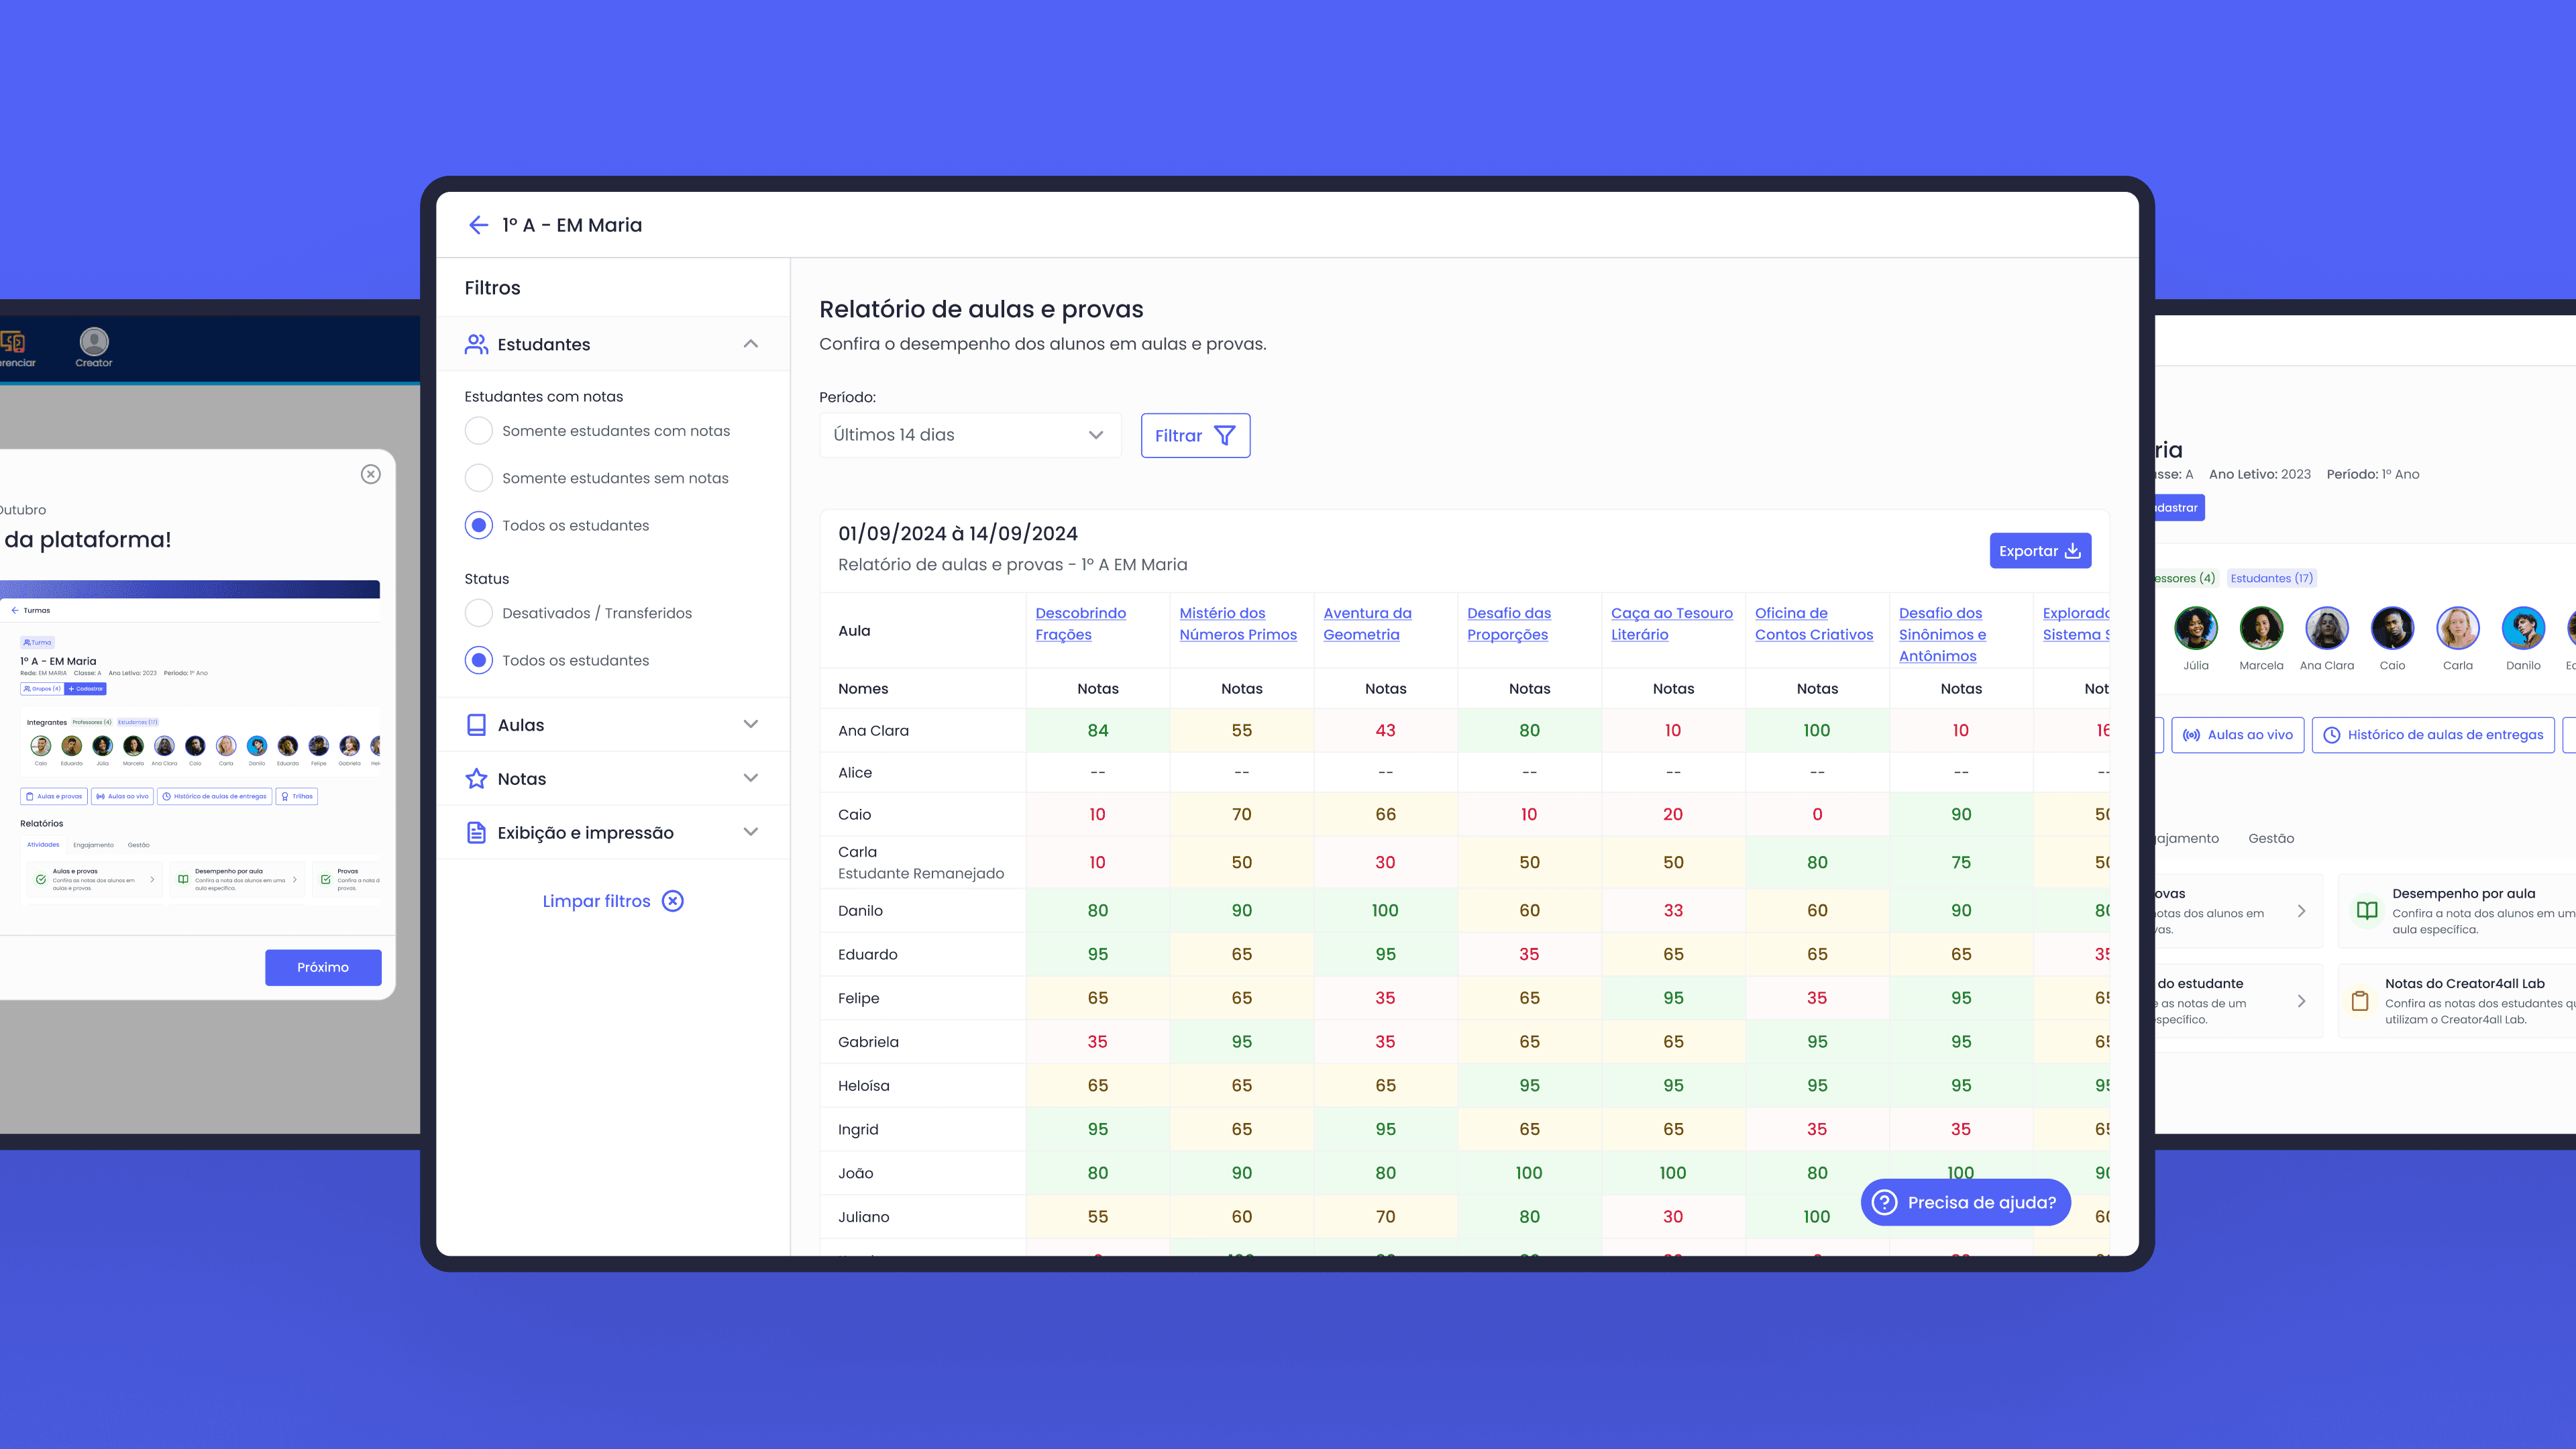
Separating the report timeframe from other filters and organizing options into expandable menus can offer a progressive experience, making it easier to understand and reducing complexity for users.
Simplifying the report export process
The “Copy as image” feature can streamline exporting, reducing reliance on external tools and optimizing the workflow.
Linking system documentation to its features
Making access to documentation more visible can encourage users to rely on it for support, fostering better integration with the platform's features.
Validating with users
I conducted moderated, remote usability testing sessions using the Maze tool. Five users participated: one teacher and four Creator4All partners.
All five participants successfully completed every task.
Some users found the filter category label “Display and printing” ambiguous.
Some users did not immediately notice the report categorization tabs.
Opportunities for improvement were identified and slated for future fixes.
User feedback
Three participants commented that the interface felt lighter and more user-friendly.
Two participants highlighted that the new filter design reduced the visual clutter present in the previous version.
One participant noted that this filter organization facilitates the platform's growth and scalability.
What did I learn during this project?
Considering the scalability of solutions ensures a seamless and consistent experience.
Creating low-fidelity sketches helps save time and avoid rework.

